MLB Underdog Betting: Systems, Situations and ROI Data for Plus-Money Value
Loading...
MLB underdog betting is the closest thing to a structural edge that exists in mainstream sports wagering. I do not say that lightly. In football, underdogs win roughly 30% of matches – not enough to overcome the vig at typical plus-money prices. In basketball, the gap between favourites and underdogs is wide enough that the market prices it efficiently. But in baseball, underdogs win approximately 44% of all games. Four out of every nine. At average plus-money odds of +136.8, that win rate does not just break even – it prints profit.
I spent my first two seasons ignoring this. Like most recreational bettors, I backed favourites because favourites felt safe. The starter was better, the lineup was deeper, the record was stronger. What I did not realise is that a decade of data shows blind favourite betting on every MLB game produces a loss exceeding $7,000 on $100 flat stakes. The favourites win more often, yes – but not often enough to justify the price you pay for them.
This guide breaks down the mathematics, the situational systems that filter generic underdog value into actionable setups, and the traps that turn a sound concept into a losing week. If you are placing bets from the UK, there is a separate section covering the practical realities of timing, market access and bankroll sizing in GBP. The numbers are real, the edge is documented, and the only question is whether you have the discipline to back losers often enough to let the maths work.
A quick framing note: underdog betting is not about finding miracles. It is about finding mispricing. The bookmaker’s job is to set a line that attracts action on both sides and embeds a margin. When the public over-bets favourites – which they do consistently in baseball – the underdog price gets pushed higher than the true probability warrants. Your job is to identify those situations, back the dog at an inflated price, and trust the sample size to deliver the mathematical edge over months, not days.
The Maths of MLB Underdogs: Why 44% Win Rates Print Money at Plus Prices
A friend of mine once argued that a 44% win rate could not possibly be profitable. “You lose more than you win,” he said, as if frequency was the only variable. I asked him whether he would take a coin flip at 2.36 decimal odds. He said yes immediately. That is exactly what MLB underdog betting offers – except the coin lands heads 44% of the time instead of 50%, and the odds compensate for it.
The arithmetic is simple and brutal. MLB favourites win about 57.5% of games at an average moneyline of -142.6 (decimal 1.70). Underdogs win 41.2% at an average moneyline of +136.8 (decimal 2.37). To break even at +136.8, you need to win 42.3% of your bets. The actual underdog win rate of 44% exceeds that threshold by 1.7 percentage points. That gap is your profit margin – small on any individual bet, but compounded across hundreds of wagers per season, it is real and it is persistent.
Now flip it. Betting $100 on every favourite across a full season means laying an average of $142.60 to win $100 on each game. You win 57.5% of the time, netting $100 per win. You lose 42.5% of the time, losing $142.60 per loss. The net across a ten-year study: a loss exceeding $7,000. Favourites win more games, but the price you pay for them eats the profit and then some. The market knows who is going to win most of the time – and it charges you dearly for that knowledge.
The crucial concept is break-even win percentage. For any given plus-money price, you can calculate the minimum win rate needed to break even: 1 / decimal odds x 100. At 2.00 (+100), you need 50%. At 2.50 (+150), you need 40%. At 3.00 (+200), you need 33.3%. Now compare those thresholds to the actual win rates within each price tier. Underdogs priced between +100 and +130 win roughly 46-47% of their games – well above the 43-45% break-even range for those prices. Underdogs priced between +130 and +180 win about 40-42%, which still clears the 36-40% break-even zone. The edge narrows at longer prices (+200 and beyond) because those teams genuinely are overmatched, but the profitable sweet spot between +100 and +180 is wide and well-documented.
I split my underdog tracking into these three tiers – short dogs (+100 to +130), mid-range dogs (+131 to +180) and long shots (+181 and up) – and review the ROI of each tier at the end of every month. The short-dog tier consistently produces the highest ROI because the win rate is closest to 50% while the plus-money return still adds up. The mid-range tier has more variance month to month but remains profitable across full seasons. The long-shot tier is where most of the losses accumulate: the 28-32% win rates at those prices rarely overcome the break-even threshold, and the occasional big payout creates an illusion of value that the aggregate results do not support.
One thing the raw numbers do not show is the psychological toll. You will lose more bets than you win. That is a mathematical certainty with a 44% strike rate. If you cannot tolerate three consecutive losses on a Tuesday without abandoning the approach, underdog betting is not for you – not because it does not work, but because you will not stay in the seat long enough for it to work. The maths is on your side, but only if you let it play out over sample sizes of 200+ bets. Anything less and variance rules.
Situational Underdog Systems: Home Dogs, Division Rivals and Post-Loss Bouncebacks
Generic underdog betting is profitable. Filtered underdog betting is more profitable. The difference between the two is the difference between a flat 2% ROI and pockets of 5-7%+ ROI – and the filters are not complicated. They are situational: where is the game being played, what happened yesterday, and how familiar are these teams with each other?
Home underdogs: the strongest single filter. MLB home underdogs posted a 45.9% win rate in 2025. That is nearly two percentage points above the overall underdog average of 44%, and at plus-money prices, those two points are enormous. The home-field advantage in baseball is modest compared to football – roughly 54% for the home side across all games – but when the market prices a home team as an underdog, it is often overcorrecting for a pitching matchup disadvantage or a recent losing streak. The home crowd, the batting last advantage and the familiarity with the park create a floor that the odds frequently undervalue.
Why does this persist year after year? Because the public loves road favourites with name-brand starters. When an elite arm visits a smaller-market team, the tickets pile up on the favourite, and the bookmaker shades the line accordingly. The home underdog’s actual win probability might be 46%, but the line prices them at 42-43%. That gap is the edge, and it recurs because the public’s behaviour does not change.
Division underdogs after a Game 1 loss. This is the most specific and, in my experience, the most reliable situational system in MLB underdog betting. The setup: a team loses Game 1 of a series at home as a favourite, then shows up as a home underdog in Game 2 with a line between +100 and +145. Over a ten-year sample, this filter produced a 48.1% straight-up win rate and a +7.2% ROI. Nearly half the time, the team that lost yesterday’s game as a home favourite bounces back and wins the next day as a home underdog – at plus-money odds.
The logic is sound. Division rivals play each other 19 times per season, so familiarity is high. The Game 1 loss as a home favourite means the market considered this team the better side yesterday; the line has now over-adjusted because of a single result. Add the home-field advantage and the likelihood of a different starting pitcher, and you have a situation where the market is punishing a team for one game’s variance rather than reassessing its actual quality.
I track this system separately in my records, and the hit rate has held above 46% in every full season I have monitored. The sample sizes are not enormous – roughly 80-100 qualifying games per year – but the consistency across multiple seasons gives me confidence that it is a real edge rather than a statistical artefact.
Post-loss bouncebacks in general. Beyond the division-specific filter, teams that lost the previous game as a home favourite and are now listed as underdogs (home or road) show a modest but positive ROI across the board. The market over-adjusts to yesterday’s result, particularly when the loss was lopsided. A 9-2 blowout loss yesterday makes the public even more eager to fade the loser today, which inflates the underdog price beyond what the fundamentals justify. I look for these setups on days with heavy slates – 12 or more games – where the bookmaker has less time to fine-tune each line.
A practical note on system betting: no filter is a magic key. Each one narrows the sample and increases the variance. A system with a 48% win rate over 100 annual qualifying bets will still produce months where you go 8-15. If you stack multiple systems on the same bankroll, ensure your unit sizing accounts for the combined exposure. I allocate no more than 30% of my total MLB action to situational underdog systems, with the remainder on targeted home-underdog plays and standard moneyline analysis.
When Underdog Value Is a Trap: Spots to Avoid in MLB
Not every underdog is an opportunity. Some are genuinely bad teams getting exactly what they deserve from the market, and backing them because the price looks juicy is how you give back everything the situational systems earned you. I have a short list of traps I avoid, and it has saved me more money than any single system has made me.
Ace versus replacement-level starter. When the opposing team sends out a Cy Young-calibre arm and your side counters with a recently called-up fifth starter or a spot opener, the underdog price is not value – it is an accurate reflection of a massive pitching mismatch. The 44% overall underdog win rate drops to the low 30s in these matchups because starting pitching dominance compresses the probability distribution. If the starter on the other side has an ERA under 2.50 and a strikeout rate above 30%, I pass regardless of the price.
Extreme weather favouring the power team. Wind blowing out at 15+ mph at a hitter-friendly park fundamentally shifts the game’s run-scoring environment. If the favourite has more power in its lineup – higher team Barrel%, more home runs per game – the weather amplifies their advantage in a way the market does not always fully price. Underdog value in these spots is illusory because the environmental variable favours the side that was already better. I cross-check weather data on every game where the total is set above 9.5; if wind and temperature both favour offence, I scratch the underdog bet.
September tanking. Teams eliminated from playoff contention in September start resting regulars, shutting down pitchers and auditioning minor-league call-ups. These teams are underdogs for good reason – they are not trying to win in the traditional sense. The situational systems I outlined above explicitly exclude September games involving eliminated teams because the behavioural dynamics change too dramatically. Motivation is not a stat you can model, but its absence is visible in lineup cards.
Travel and schedule fatigue. A team finishing a 10-game road trip, crossing time zones for the third time in a week, playing its fourth game in three days – that team is an underdog for operational reasons, not just matchup reasons. The fatigue compounds in ways that do not show up in the pitching data, and the bullpen is likely stretched thin from the extended travel. I flag any underdog that has played four or more consecutive road games and reduce my stake or skip the bet entirely.
Post-extra-innings bullpen depletion. If the underdog played a 12-inning game last night and burned through six relievers, the available arms today are the ones the manager did not trust in a close game. The starters get the attention, but the bullpen hangover is where the trap hides. Check the previous night’s box score before committing to any underdog in the second or third game of a series.
I run each underdog candidate through a five-point trap check before placing any bet: opposing starter quality, weather and park conditions, team motivation context, travel load and bullpen availability. If two or more of those five points flag negative, I scratch the bet regardless of how attractive the price looks. The discipline to pass on a bad setup is worth more than the courage to back a good one, because one trap loss at +130 requires nearly two wins at the same price just to break even.
Placing Underdog Bets From the UK: Timing, Markets and Odds Formats
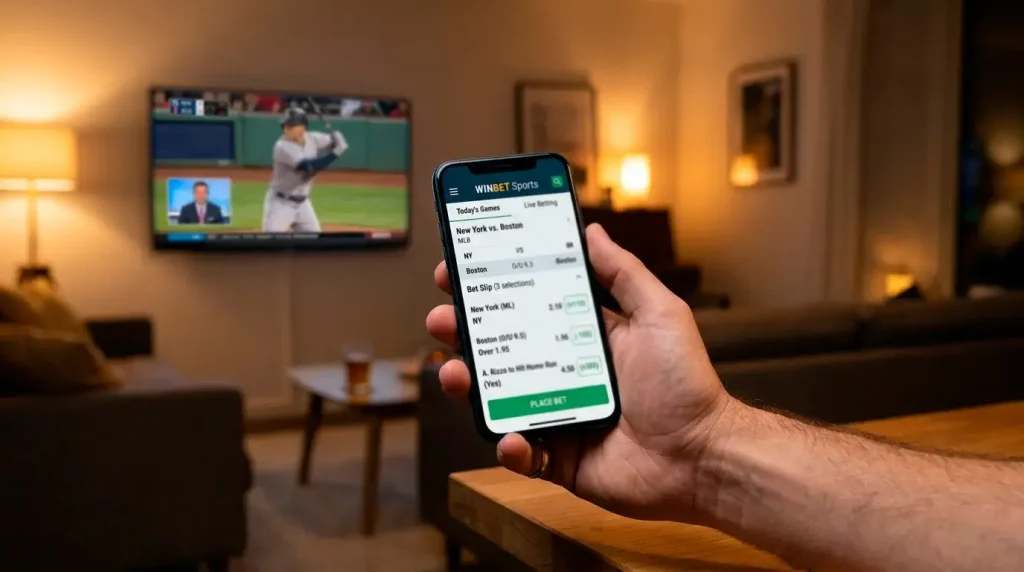
Placing underdog bets on MLB from the UK introduces a set of practical considerations that US-based guides never mention, and getting them wrong can quietly erode an otherwise sound strategy. The first is timing. The typical MLB evening slate begins at 00:00 to 01:00 BST – midnight or later for most UK bettors. Matinee games start around 18:00 BST, which is manageable, but the full evening card often means either staying up late or placing bets earlier in the day and accepting the information gap.
I have tried both approaches. Betting in the afternoon UK time, before lineups are confirmed, means you get the earliest price – often the softest – but you carry risk on late scratches and lineup changes. Betting at midnight after lineups are public gives you full information but the line has already moved to account for it. My compromise: I place underdog bets on matinee games (18:00 BST start) after lineups drop, and for the late slate, I set conditional alerts on my bookmaker app to notify me if specific lines hit my target price, then place the bet from my phone if the conditions are met. About 76% of young UK bettors already use mobile for gambling, so the workflow is built for the platform most people already use.
Market access is the second consideration. Not all UKGC-licensed bookmakers offer the same depth of MLB markets. Moneyline is universally available, but run lines and totals may be absent on smaller platforms. For underdog betting specifically, moneyline is the primary market – you need the plus-money price, and that comes from the moneyline. Ensure your bookmaker offers MLB moneylines for the full slate, not just the headline games. Some platforms only list five or six MLB matches per day, which limits your filtering options significantly.
Bankroll management in GBP is straightforward but worth stating explicitly. A starting bankroll of £500 at 1-2% unit sizing gives you £5-10 per bet. On underdog plays, where the win rate is 44-48%, you should plan for drawdowns of 10-15 units during cold streaks. That means your £500 bankroll needs to tolerate a temporary dip to £425-450 without triggering panic or strategy abandonment. Set your unit size at the start of each month and do not adjust mid-month regardless of results. The systems work over seasons, not weeks.
Responsible gambling applies to underdog betting as sharply as it does to any other approach. The losing streaks inherent in a 44% win-rate strategy can trigger chasing behaviour – doubling stakes after losses to “get back to even” – which is the fastest route to a blown bankroll. If you find yourself increasing unit size after a loss, that is a red flag. Dr. Harry Levant of the Public Health Advocacy Institute has been vocal about the betting industry’s impact on vulnerable individuals, and his message resonates here: set your limits before you start, use the deposit-cap tools that every UKGC-licensed bookmaker is required to offer, and if the process stops feeling like analysis and starts feeling like compulsion, step away. GamStop self-exclusion exists for exactly this reason, and there is no shame in using it.
What is the historical win rate for MLB underdogs?
MLB underdogs win approximately 44% of all regular-season games, making baseball the most underdog-friendly major sport for bettors. At average plus-money odds of around +136.8 in American terms (2.37 decimal), that win rate exceeds the break-even threshold of 42.3%, producing a small but consistent long-term profit on flat stakes.
Are home underdogs more profitable than road underdogs in baseball?
Yes. Home underdogs posted a 45.9% win rate in 2025, nearly two percentage points above the overall underdog average. The home-field advantage – batting last, park familiarity, crowd support – creates a floor that the market frequently undervalues when the pitching matchup tilts in the visitor’s favour. Home underdogs between +100 and +145 are the most profitable price tier.
Should I only bet underdogs against non-ace starters?
Not exclusively, but avoiding underdogs facing elite aces (sub-2.50 ERA, 30%+ strikeout rate) is a sound filter. In those matchups, the underdog win rate drops into the low 30s, which is below break-even at most plus-money prices. The strongest underdog setups occur when the opposing starter is a mid-rotation arm and the situational filters – home field, division rivalry, post-loss bounceback – align.
This material was created by the bestmlbbetuk.com team.
Related posts
MLB September Betting Strategy: Contenders, Tanking Teams and Playoff-Race Edges
MLB Totals Betting: Over/Under Strategy Using Weather, Ballpark and Pitcher Data