MLB Player Props: How to Find Edge in Strikeout, Home Run and Hits Markets
Loading...
MLB player props are where the sharpest edges in baseball betting live right now – and also where the most spectacular traps hide. I started taking prop markets seriously three seasons ago after noticing that the strikeout lines on mid-rotation starters were consistently soft compared to my own projections. The bookmakers were pricing name recognition; I was pricing K-rate against the opposing lineup’s whiff tendencies. That gap was real, it was repeatable, and it fundamentally changed how I allocate my bankroll across a full season.
But the landscape is shifting. MLB owners approved a $200 cap on pitch-level prop wagers in November 2025, and pitch bets were excluded from parlays entirely. That cap was not an arbitrary number – it was a direct response to integrity concerns that rattled the league from the inside out. The message is clear: MLB considers individual-performance markets high-risk, and the restrictions are likely to tighten before they loosen.
For UK bettors, the prop market looks different again. Not every bookmaker licensed by the UKGC offers the same depth of MLB props, and the lines that are available tend to carry wider margins than their US counterparts. This guide maps the terrain – what prop markets exist, which metrics drive them, and how to build a basic pricing model using data that is free and publicly accessible. No proprietary tools required, no subscriptions needed, just a spreadsheet and some discipline.
Before we get into the mechanics, a framing point: player props should be a complement to your main-market betting, not a replacement. The variance on an individual performance is inherently higher than on a team outcome. A pitcher can lose his command in the second inning for reasons no model predicted; a hitter can face a shift that turns two line drives into outs. Props reward specialisation and patience – know a few markets deeply rather than spreading yourself thin across everything the bookmaker offers.
The Anatomy of MLB Prop Markets: Strikeouts, Home Runs, Hits, Bases and Pitching Lines
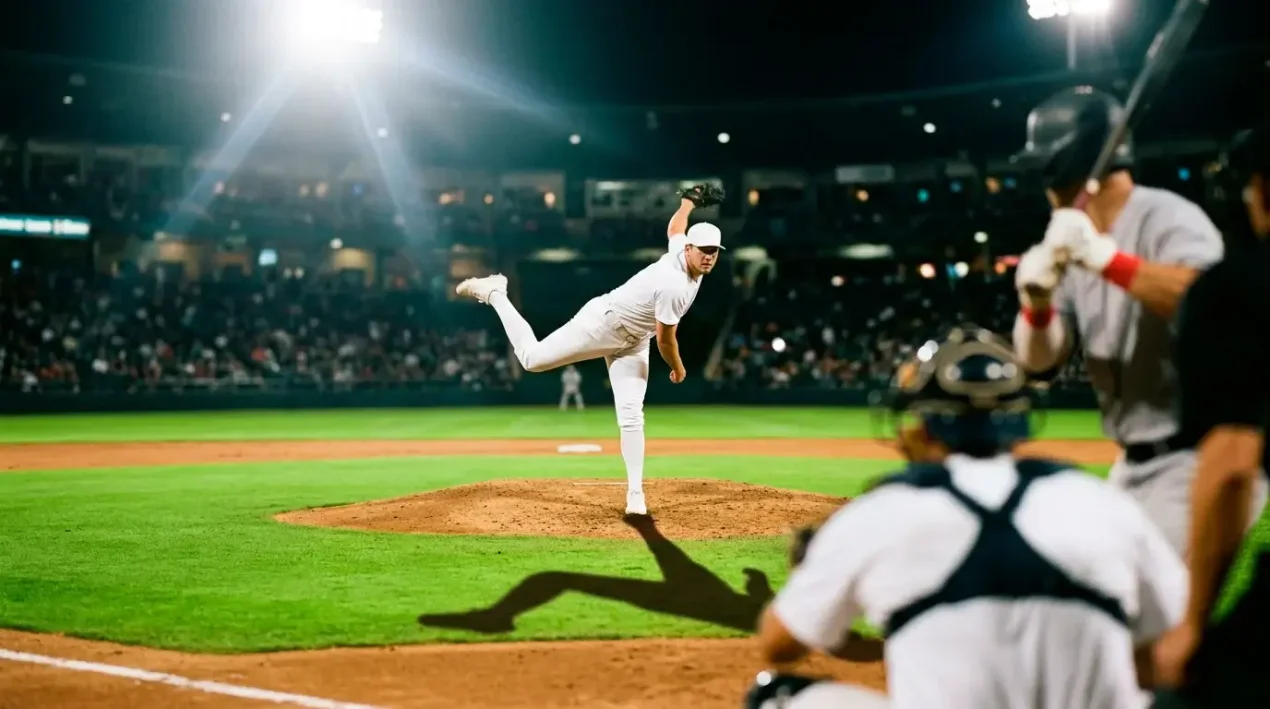
The first prop line I ever studied was a strikeout total, and I distinctly remember thinking: “This is just one number – how complicated can it be?” Very, as it turns out. MLB prop markets are not monolithic. They are a web of interconnected individual-performance bets, each with its own pricing logic, its own data inputs and its own set of bookmaker biases. Understanding the structure before you start modelling is essential.
Pitcher props form the backbone of the market. The most liquid is the strikeout line – typically set as an over/under at a half number (e.g., over/under 5.5 Ks). Beyond strikeouts, you will find outs recorded (how deep the starter goes), earned runs allowed and, at some books, hits allowed. Each of these correlates with different statistical inputs. Strikeouts lean on K-rate and swing-and-miss data. Outs recorded depends on pitch efficiency and the manager’s leash. Earned runs blend pitcher quality with opponent power metrics and park factors.
Hitter props are the other half of the ledger. The headline markets are home runs, hits, total bases and runs batted in. Home run props are binary on most platforms – will the batter hit one, yes or no – priced as a moneyline rather than an over/under. Hits and total bases use the familiar over/under structure, usually centred around 0.5, 1.5 or 2.5. RBI markets are less common at UK bookmakers and carry wider margins, which makes them harder to find value in unless you have a strong model for run-scoring context.
Then there are the niche props: stolen bases, walks drawn, pitcher wins and, until the November 2025 restrictions, pitch-level markets such as whether a specific pitch would be a ball or strike. The $200 cap on pitch-level wagers effectively killed that micro-market for serious bettors, but it remains important to understand why it existed and why MLB shut it down – it directly shapes which prop markets the bookmakers are willing to offer and how aggressively they price them.
A practical note for anyone coming from football betting in the UK: MLB props are not like anytime goalscorer markets. In football, an anytime scorer bet is largely binary and loosely priced. MLB props are granular, data-rich and increasingly model-driven. The bookmakers use Statcast data – exit velocity, launch angle, sprint speed – to set their lines, which means you need the same data to compete. The good news is that all of it is free on Baseball Savant. The bad news is that most recreational bettors never bother to look.
Pricing dynamics differ across prop categories in ways that matter for your bankroll. Strikeout props carry the tightest margins because they are the most heavily traded – the vig typically sits around 8-10%, comparable to main markets. Home-run yes/no props, by contrast, carry margins of 15-20% because the bookmaker is pricing a low-probability event with high variance. Hits and total-bases markets fall somewhere in between. When you are deciding where to focus your modelling energy, the margin structure should guide you: tighter margins mean less vig to overcome, which means a smaller edge can still generate profit over time.
Strikeout Props: The Headline Metrics
I keep a running note on my phone titled “K-line gifts” – moments when a bookmaker posts a strikeout over/under that is two full strikeouts below what my model projects. Those gifts appear two to three times a week during a full slate, and they are almost always on mid-tier starters that the market has not figured out yet. Strikeout props are the most liquid player-prop segment in MLB, and that liquidity is both the opportunity and the challenge.
Two metrics dominate K-prop analysis. The first is K/9 – strikeouts per nine innings, the classic rate stat. It tells you how often a pitcher misses bats relative to his workload. A starter sitting at 10.0 K/9 is elite; anything above 8.5 is strong. But K/9 alone is incomplete because it does not account for contact quality or sequencing. The second metric, swinging-strike rate (SwStr%), fills that gap. SwStr% measures the percentage of total pitches that generate a swing and miss. League average hovers around 11%; an elite starter with a devastating slider might sit at 14-15%. When K/9 and SwStr% both point in the same direction, the strikeout projection gains confidence.
What makes K-props particularly interesting for bettors is that the opposing lineup’s tendency to strike out – the team K-rate – creates a matchup variable that bookmakers sometimes underweight. A pitcher with a 9.0 K/9 facing a lineup that strikes out 26% of the time is a different proposition from the same pitcher facing a disciplined team that whiffs at 20%. The deeper tactical breakdown of how to model these matchups sits in a dedicated strikeout-props analysis, but the key insight here is that K-props reward matchup-level thinking, not just pitcher-level thinking.
One thing I have noticed over three seasons of tracking K-prop results: the market is sharpest on aces and softest on the fifth starter. Everyone knows what a top-tier arm will do against most lineups, so the bookmaker prices those lines aggressively. But a mid-rotation starter making his twelfth start of the season? The book relies on a season-long K/9 that may not reflect a recent mechanical tweak, a new pitch mix or a change in usage pattern. That is where the model shines – it catches what the line has not yet absorbed.
Home Run and Hits Props at a Glance
Home run props taught me something about weather that I never expected to matter. On a warm June evening with the wind blowing out at 12 mph, a fly ball that dies on the warning track in April becomes a souvenir in the car park. Robert K. Adair’s work on the physics of baseball quantified this precisely: every single mph of wind adds roughly three feet to ball flight, a 10-degree Fahrenheit temperature increase boosts distance by about 1%, and a one-inch drop in air pressure adds 1.5%. Those numbers turn a borderline fly-out into a home run and a quiet game into a slugfest.
The metrics that drive home-run props are Barrel percentage (Barrel%) and exit velocity (EV). A barrelled ball – defined by Statcast as a batted ball with the optimal combination of exit velocity and launch angle – leaves the park at a far higher rate than any other contact type. When a hitter’s Barrel% exceeds 10%, he is a genuine power threat on any given swing. Pair that with a park that ranks above league average for home runs per game, and the probability shifts meaningfully.
Hits and total-bases markets are softer in a different way. They are less volatile than home-run props because the outcome distribution is wider – a batter can reach 1.5 total bases with a single and a walk, not just with a home run. That stability makes hits/total-bases props attractive for bettors who prefer higher hit rates and lower variance. The key metric here is expected slugging (xSLG), which strips out luck and park factors to project what a hitter’s power output should be based on his quality of contact.
I treat these markets as a complement to strikeout props rather than a standalone focus. On nights where the weather data and park factors align, home-run props become high-value targets. On neutral or pitcher-friendly nights, I lean toward hits and total-bases markets where the edge is smaller but more consistent. The detailed modelling framework for these props lives in dedicated guides – what matters at this level is understanding that each market has its own data inputs and its own risk profile.
A word on sample sizes: hitter-prop models need more data to stabilise than pitcher models. A starter accumulates meaningful K-rate data within 8-10 starts. A hitter’s Barrel% needs at least 100 batted-ball events to be reliable, which for a regular starter usually means six to eight weeks of the season. Early in the year, lean on the pitcher side of the prop market where the data matures faster. By June, the hitting metrics have enough volume to be actionable.
Prop Betting Integrity: Why It Matters for Your Market Access
Prop markets do not exist in a vacuum – they exist at the mercy of league policy, and that policy is tightening. MLB’s decision to cap pitch-level prop wagers at $200 and exclude them from parlays in November 2025 was the most significant restriction the sport has imposed on betting markets since legalisation began. Commissioner Rob Manfred has been blunt about the league’s priorities: protecting game integrity sits above all else, and the monitoring systems in place are designed to catch aberrational betting patterns before they become scandals.
For you as a bettor, the practical fallout is straightforward. Certain prop markets that existed a year ago are now either capped or gone entirely. Pitch-level wagers – whether the next pitch will be a ball or a strike, whether the at-bat will end in a strikeout – were the fastest-growing micro-market in MLB props. They attracted sharp action and recreational punters alike. Now they are economically irrelevant for anyone wagering more than pocket money. The bookmakers did not fight the cap; they implemented it immediately, which tells you how nervous the industry was about the integrity exposure.
The ripple effects extend beyond pitch props. UK bookmakers, already more conservative with MLB market depth than their US counterparts, have used the integrity climate as justification for tighter limits on strikeout and earned-run props. If you place prop bets through a UKGC-licensed book, expect lower maximum stakes on individual-performance markets compared to moneyline or totals. That is not a conspiracy – it is risk management, and understanding it saves you the frustration of building a sophisticated model only to discover you cannot get meaningful money down.
The broader lesson here is that prop markets are not static. The rules changed in 2025, and they will change again. Nearly half of Americans now believe legal sports betting diminishes the integrity of games – that number climbed from 41% to 49% between February and November of 2025 alone. Public sentiment drives regulation, and regulation drives market access. If you are building a prop-betting strategy for the long term, build it with the assumption that the most exotic markets will face increasing scrutiny and potential restrictions. Focus your edge on the markets most likely to survive: strikeout totals, hits over/unders and total bases – the workhorses that generate enough volume for bookmakers to keep offering them with reasonable limits.
Building a Simple Prop Pricing Model With Publicly Available Data
I built my first prop-pricing model on a Saturday morning with a cup of coffee and a Google Sheet. It was ugly, it was basic, and it outperformed my gut feel on strikeout props by 8% ROI over the next three months. You do not need Python. You do not need machine learning. You need a structured way to combine publicly available data into a number you can compare against the bookmaker’s line.
The process I use for strikeout props, step by step. Start with the pitcher’s season K% – the percentage of plate appearances that end in a strikeout. A pitcher with a 28% K-rate is striking out roughly one in four batters he faces. Now pull the opposing team’s K-rate as a lineup – how often they strike out against all pitching. League average sits around 22-23%. If the opposing lineup strikes out at 26%, they are high-whiff; at 19%, they are disciplined.
Next, create a matchup-adjusted K-rate. The simplest method: multiply the pitcher’s K% by the opponent’s K-rate, then divide by the league average K%. If the pitcher’s K% is 0.28, the opponent’s team K% is 0.26 and the league average is 0.23, the calculation is (0.28 x 0.26) / 0.23 = 0.316. That adjusted rate is your matchup projection: this pitcher, against this lineup, should strikeout roughly 31.6% of batters.
Now multiply by expected batters faced. If the starter typically pitches six innings and faces 24 batters, your projected strikeout total is 0.316 x 24 = 7.6. The bookmaker has the line at 6.5 Ks. Your model says 7.6. That is a meaningful gap, and it gives you a clear lean toward the over. Adjust for the ballpark – some venues suppress strikeouts (Fenway’s short wall changes approach at the plate), others inflate them (pitcher-friendly parks with deep power alleys). In 2025, only 30 starters averaged six-plus innings per game, so if your pitcher is not one of them, reduce the batters-faced projection accordingly.
The same logic extends to hits and total-bases props. Replace K% with the hitter’s batting average against the opposing pitcher’s handedness, adjust for park factor and recent form (last 14 days, not last three games – the sample needs some stability), and compare to the bookmaker’s line. For home-run yes/no props, use the hitter’s Barrel% against the pitcher’s hard-hit rate allowed, weight by park HR factor, and convert to a probability.
I run this process every morning during the season. The entire model lives in a single spreadsheet with formulas that auto-populate once I enter the day’s matchups. It takes 20 minutes to price a full slate of props, and it gives me a concrete number to compare against the market – which is infinitely better than looking at a line and thinking “that feels low.” Feelings do not track over 2,430 games. Numbers do.
One last consideration: bankroll sizing for props should be tighter than for main markets. The variance on individual-performance bets is inherently higher because a single at-bat or a single inning can swing the outcome. I cap my prop exposure at 0.5-1% of bankroll per wager, roughly half of what I stake on moneyline or totals bets. In GBP terms, on a £500 bankroll that means £2.50 to £5 per prop. It sounds modest, but compounded across 150+ prop bets per season, the returns add up – and the drawdowns stay manageable.
What are the best MLB prop bets for beginners?
Strikeout over/unders are the best entry point. They have the most liquidity, the most available data and the most transparent pricing logic. Start by comparing a pitcher’s K/9 rate against the opposing lineup’s strikeout tendency, then see if the bookmaker’s line aligns with your projection. Avoid pitch-level and RBI props until you are comfortable with the modelling process.
How do prop bet limits vary between UK bookmakers?
Limits vary significantly. Some UKGC-licensed bookmakers cap MLB prop wagers at as little as £10-20, while others allow stakes up to £100+ on headline markets like strikeout totals. Pitcher props generally carry higher limits than hitter props due to greater liquidity. Check the maximum stake before building a position – there is no point modelling a bet you cannot size properly.
Can you combine MLB player props in an accumulator?
Most UK bookmakers allow you to combine player props in accumulators, but with restrictions. Same-game prop accumulators may have correlation adjustments built into the pricing, meaning the combined odds are lower than a simple multiplication would suggest. Pitch-level props are excluded from parlays entirely following the 2025 MLB cap. Always check the specific terms for each bookmaker’s accumulator rules on baseball markets.
This material was created by the bestmlbbetuk.com team.
Related posts

MLB September Betting Strategy: Contenders, Tanking Teams and Playoff-Race Edges

MLB Totals Betting: Over/Under Strategy Using Weather, Ballpark and Pitcher Data