Official MLB Umpire Strike Zone Models
 Available in US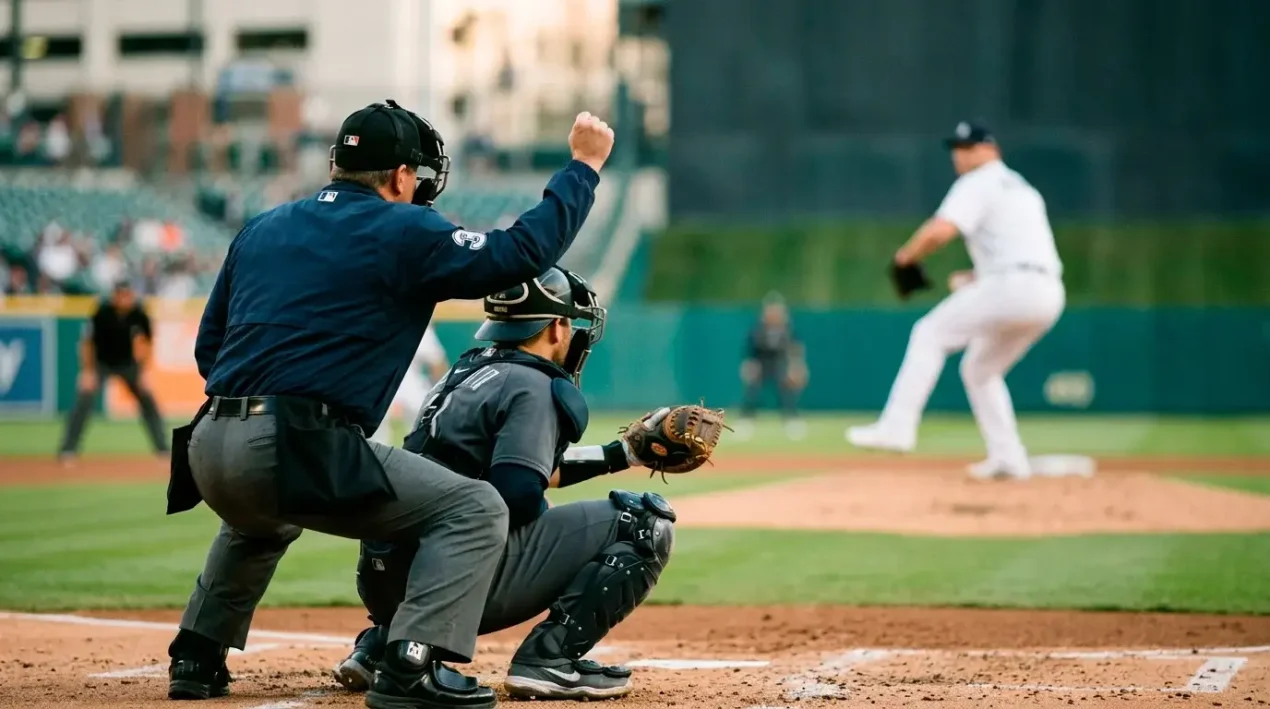
Umpire analysis is one of the last genuinely underexploited edges in MLB betting. Most recreational bettors never check who is behind the plate, and even some sharp bettors treat it as a tiebreaker rather than a primary input. With 2,430 regular-season games spread across a pool of roughly 90 umpires, the data accumulates quickly, and the tendencies are more stable than you might expect. This guide walks through where to find umpire data, how it affects totals and strikeout props, and the specific adjustments I make to my model based on the plate assignment. For a companion look at how environmental factors shift totals alongside umpires, the MLB totals betting guide covers weather, ballpark dimensions and pitching matchups.
Official Sources for MLB Umpire Strike Zone Analytics
Before the 2015 Statcast rollout, umpire analysis was guesswork. Today, every pitch in every MLB game is tracked by high-speed cameras that record whether the ball crossed the strike zone as defined by the rulebook. That tracking data is publicly available, and it reveals consistent, measurable differences between umpires in how they call the zone. As Rob Manfred has noted, having systems in place that provide access to data is central to maintaining the integrity of the game — and that same data infrastructure gives bettors a window into umpire behaviour that did not exist a decade ago.
The primary sources I use are UmpScorecards — a free site that grades every umpire’s performance after each game — and Baseball Savant’s pitch-tracking data. UmpScorecards provides a called-strike rate, a consistency percentage, and a visual map of where each umpire’s zone differs from the rulebook. The key metric is called-strike rate above or below average: an umpire who calls strikes at a rate 3-4% above average effectively expands the zone, which benefits pitchers and suppresses offence. An umpire with a below-average called-strike rate shrinks the zone, which forces pitchers to throw more hittable pitches and inflates run scoring.
Umpire assignments are typically published the morning of each game, which gives you several hours before first pitch to check the data and adjust your positions. I have a simple spreadsheet that maps each umpire to his career called-strike rate, average runs per game, and average strikeouts per game. When the assignment drops, I cross-reference it against my existing leans for the day and adjust the total by 0.3 to 0.5 runs depending on how far the umpire deviates from average. That adjustment alone has flipped my position on totals in roughly 10-15% of games over the past two seasons.
Umpire Effect on Totals: Wide Zones Lower Runs, Tight Zones Inflate Them
The mechanism is intuitive once you see it in the data. An umpire with a wide strike zone gives pitchers borderline calls — the pitch on the black, the slider that catches the low-outside corner. Batters who know the zone is wide tend to swing at more pitches outside the traditional zone, which leads to weaker contact, more called strikeouts, and fewer walks. The cumulative effect across nine innings is a measurable reduction in runs scored.
Conversely, a tight-zone umpire forces pitchers to throw the ball over the heart of the plate more frequently. Borderline pitches that would be strikes with a generous umpire are called balls, which raises the walk rate, extends at-bats, and gives hitters more chances to wait for a pitch they can drive. The result is more runners on base, more hard contact, and more runs.
The magnitude of the effect surprised me when I first quantified it. Between the widest-zone umpires and the tightest-zone umpires, the average total difference is roughly 0.8 to 1.0 runs per game. That is a significant portion of the total line itself, which typically ranges from 7.0 to 10.5 in MLB. If the bookmaker sets a total at 8.0 and the plate umpire has a career average total of 8.7, you have nearly a full run of edge on the over — assuming all other factors are held constant.
In practice, I never use umpire data in isolation. It is one input alongside pitching matchups, weather, and ballpark factors. But it is the one input that most bettors ignore entirely, which makes it the most likely source of unpriced edge. When the umpire data aligns with my other factors — a wide-zone umpire in a game featuring two strong starters in a pitcher-friendly park — the convergence of evidence pushes me toward a high-confidence under that the market has not fully discounted.
Umpire Effect on Strikeout Props: Expanding the Overlap With Pitcher Metrics
The same expanded zone that suppresses runs also inflates strikeout totals, and this is where umpire analysis becomes especially powerful for prop bettors. A wide-zone umpire gives pitchers an extra inch or two on the corners, which turns borderline balls into called strikes. That expansion raises the called-strike rate, which means batters fall behind in the count more often, and counts with two strikes produce more strikeouts by definition.
When I evaluate a strikeout prop, I layer umpire data on top of the pitcher’s swinging strike rate and the opposing lineup’s whiff percentage. In 2025, only 30 MLB starters averaged six or more innings per game, which means the umpire effect is concentrated in fewer innings and therefore has a proportionally larger impact on the K total for each start. An elite-K pitcher working with a generous umpire does not just get more called strikes — he also gets more two-strike counts, which allows him to use his put-away pitch more aggressively in the zone’s expanded edges.
My adjustment for K props is simpler than my total adjustment. If the plate umpire’s called-strike rate is more than 2% above average, I add 0.5 to my projected strikeout total for the pitcher. If it is more than 2% below average, I subtract 0.5. That half-strikeout adjustment does not sound like much, but when the prop line is 5.5 or 6.5, it frequently flips the expected value from negative to positive on the over or the under respectively. Combined with strong pitcher metrics and a favourable lineup matchup, the umpire becomes the third leg of a convergence that gives me genuine confidence in the bet.
How do umpire tendencies affect MLB betting?
Umpire strike zone tendencies directly influence run scoring and strikeout totals. Wide-zone umpires suppress runs and inflate strikeouts by expanding the edges of the strike zone, while tight-zone umpires inflate runs and reduce strikeouts. The difference between the widest and tightest umpires is roughly 0.8 to 1.0 runs per game in average total, which is a significant factor when the market total typically sits between 7.0 and 10.5.
Where can I find umpire assignment data before a game?
Umpire assignments are published on the morning of each game. UmpScorecards is the best free resource for strike zone data, providing called-strike rates, consistency scores and visual zone maps for every umpire. Baseball Savant also tracks pitch-level data that can be filtered by umpire. Check the assignment as soon as it is published and cross-reference it against your existing positions for the day.
This material was created by the bestmlbbetuk.com team.
Related posts

Weather Impact on MLB Betting: Wind, Temperature and Air Pressure Quantified

MLB Betting Mistakes: The Ten Errors That Drain Your Bankroll Fastest