
Premium Expected Value (+EV) Models
 Available in US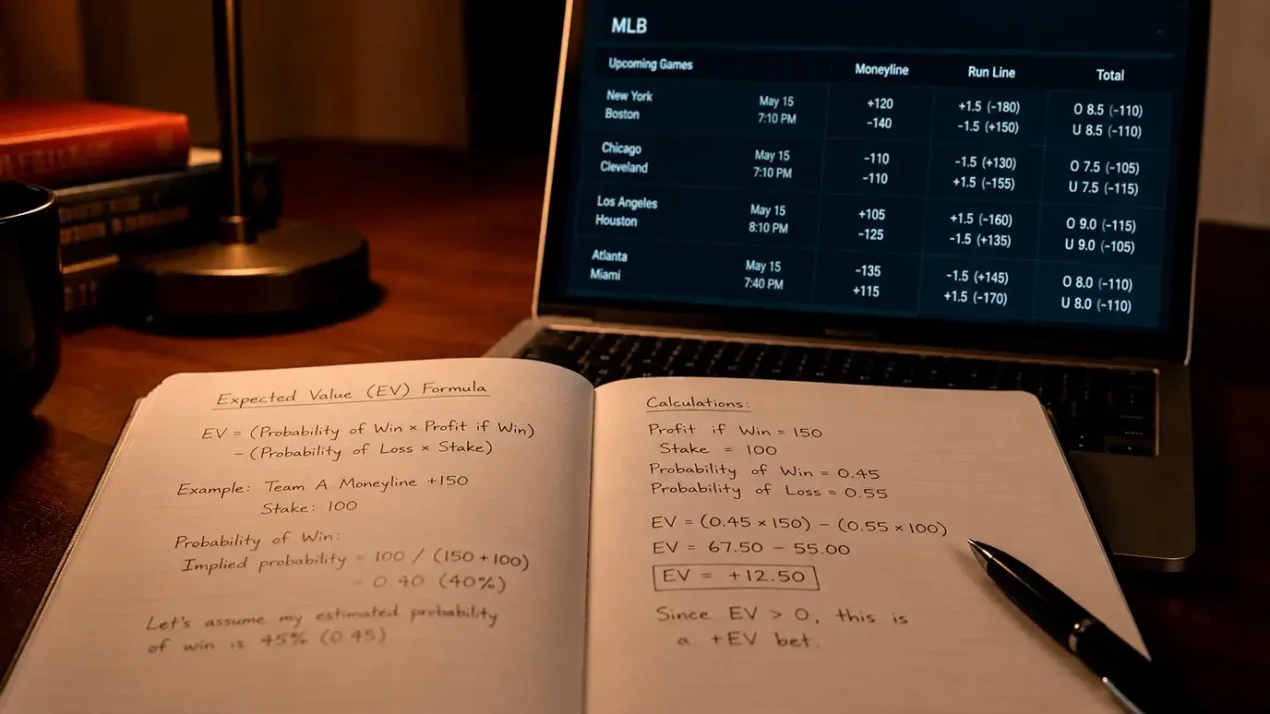
Expected value — EV — is the mathematical backbone of every profitable betting strategy. It is the single number that tells you whether a bet has a positive long-term expectation or a negative one, regardless of what happens in any individual game. In a sport with 2,430 regular-season games per year, the volume of opportunities is enormous, and a bettor who consistently identifies positive-EV spots will come out ahead over the course of a full season — even though many of those bets will lose on any given night. This guide walks through the EV formula step by step, explains how to estimate true probability, and covers why variance makes positive-EV bets feel like losing bets in the short run. For a companion piece on how to size your stakes once you have identified EV, the bankroll management guide covers Kelly Criterion and flat staking.
True Probability Estimations and the MLB Expected Value Formula
The EV formula is not complicated, but applying it correctly requires honest probability estimation — which is the hard part. The formula is: EV = (probability of winning x net profit if you win) – (probability of losing x stake lost if you lose). A positive EV means the bet is profitable in the long run; a negative EV means it is not.
Here is a worked example using real-world MLB numbers. Suppose you are evaluating a moneyline underdog at decimal odds of 2.40. You believe, based on your pitching matchup analysis, that this team has a 46% chance of winning. The calculation: EV = (0.46 x 1.40) – (0.54 x 1.00) = 0.644 – 0.540 = +0.104. That means for every £1 you stake, you expect to earn £0.104 in long-term profit. On a £50 bet, the expected profit is £5.20. That is a strongly positive-EV bet.
Now compare that to a favourite priced at 1.65 in decimal odds where you believe the win probability is 57%. EV = (0.57 x 0.65) – (0.43 x 1.00) = 0.3705 – 0.43 = -0.0595. Despite the favourite winning more than half the time, the bet carries negative expected value because the payout is not large enough to compensate for the losses. MLB favourites win approximately 57.5% of all games at an average moneyline of around -142.6 in American format, which translates to decimal odds of roughly 1.70. Blindly backing favourites at those prices has produced a loss of over $7,000 per $100 flat bet across a decade of data. That is negative EV in its purest, most expensive form.
The bookmaker’s hold rate — which reached 10.15% nationally in 2025 — is built into the odds on both sides. Your job is to find spots where your probability estimate is accurate enough to overcome that margin. If the bookmaker’s implied probability for a team is 42% (based on odds of 2.40) and your estimate is 46%, the 4% gap is your edge — provided your estimate is correct.
Estimating True Probability: Model-Based vs Market-Based Approaches
The EV formula is only as good as your probability input. Estimating the true probability of an MLB outcome is the most difficult skill in sports betting, and there are two broad approaches: model-based and market-based.
A model-based approach builds a probability from the ground up using data. You might start with each team’s season win percentage, adjust for the starting pitchers’ expected performance (using xERA, K%, and WHIP), factor in home-field advantage, account for bullpen strength, and add a weather adjustment. The output is a number — say, 48.3% — that represents your estimate of Team A’s win probability. This approach requires significant effort and a willingness to trust your numbers even when they disagree with the market.
A market-based approach uses the betting odds themselves as the starting point. The theory is that the closing line — the odds available just before first pitch — represents the market’s consensus probability after all sharp and recreational money has been absorbed. If the closing line implies a 55% probability for Team A, and your own estimate is 58%, the 3% gap is your edge. This approach requires less modelling but demands that you are consistently better than the market at pricing specific situations — which is a high bar.
In practice, I use a hybrid. My model produces an initial probability estimate, and I compare it to the current market odds. If my estimate differs from the market’s implied probability by more than 3%, I investigate further. Sometimes the investigation reveals that I missed a variable (a late lineup change, an undisclosed injury) and the market is right. Other times, the investigation confirms my edge — and those are the spots where I bet.
Why Positive EV Bets Lose in the Short Run: Variance and Sample Size
The hardest part of EV-based betting is not the maths. It is the psychology. Positive-EV bets lose regularly. A bet with a 46% win probability will lose 54% of the time — and over any five-game stretch, losing three or four out of five is completely consistent with a profitable long-term approach. The variance is real, it is uncomfortable, and it causes many bettors to abandon sound strategies prematurely.
Consider a bettor placing one positive-EV underdog bet per day at average odds of 2.30. His true win probability is 47%, which gives him a positive EV of roughly +0.08 per unit. Over 30 bets in a month, the expected value is +2.4 units. But the standard deviation over 30 bets at these odds is approximately 7.5 units. That means in any given month, his result could range from -5 units to +10 units, and both outcomes are equally likely. Two consecutive losing months — a very possible scenario — would put him down 10 units, and his confidence in the system would be shattered.
The solution is sample size. The 2,430-game MLB season gives bettors more data points than any other major American sport. A bettor who averages two bets per day will accumulate roughly 360 graded bets over a full season — not enough for certainty, but enough to see the EV signal emerging from the variance noise. At 500 bets, the signal becomes statistically meaningful. At 1,000 bets across two seasons, you can be reasonably confident that your results reflect your actual edge rather than luck.
This is why bankroll management and expected value are inseparable concepts. EV tells you which bets to place; bankroll management ensures you survive long enough for the maths to work. A bettor who finds +EV spots but stakes 5% of his bankroll per bet may not survive the variance. A bettor who finds the same spots and stakes 1% per bet will reach the 500-bet threshold with his bankroll intact — and at that point, the EV will have done its job.
What does positive expected value mean in MLB betting?
Positive expected value means that a bet, if repeated many times at the same odds and the same probability, would produce a profit over the long run. It is calculated by comparing your estimated probability of winning to the odds offered. A bet has positive EV when your probability estimate exceeds the implied probability embedded in the bookmaker’s price, and the gap is large enough to overcome the bookmaker’s margin.
How many bets do you need before expected value shows in results?
You need a minimum of 500 graded bets in a single market type before the signal from positive expected value begins to emerge reliably from short-term variance. At fewer than 500 bets, both winning and losing streaks are consistent with random fluctuation. The 2,430-game MLB season provides enough volume for an active bettor to approach that threshold within a single year if they place one to two bets per day.
This material was created by the bestmlbbetuk.com team.
Related posts

Weather Impact on MLB Betting: Wind, Temperature and Air Pressure Quantified

MLB Betting Mistakes: The Ten Errors That Drain Your Bankroll Fastest